Elastic 8.8
Elasticsearch
At the heart of the Elastic stack, Elasticsearch provides some new improvements for vector search and AI-powered search.
Elasticsearch also brings the new ingest pipeline processor, named “reroute” By default, the different integrations will send documents through the correct pipeline to the correct index, but when data all comes from a single mixed source, there’s no way to know which pipeline and index should be used without setting up a complex structure on the shipping agent.
With the reroute processor, you can set the destination based on fields present in your data, like the file path or service name. This new processor would therefore be an excellent option for Kubernetes pod logs, AWS Lambda functions, or the Syslog/journal, where data from all kinds of services pass.
Time series indices also got an improvement. Now also optimized for metrics data, it’s possible to achieve up to 90% reduction in size.
Further iterating on the Health report API introduced in 8.7, the endpoint now also includes shards capacity, which will show a yellow state if there are less than ten shards available under the cluster’s configured limit, and red when there are fewer than five available.
ENTERPRISE SEARCH
Elastic has been working on a new Machine Learning model called the Learned Sparse Encoder model, which is a big improvement for semantic search. The goal of Semantic search is to search content by its meaning rather than just matching text or keywords. The model that’s making this possible is now available in the technical preview.
Over the course of the last few releases, Elastic has been expanding on its content connectors to ingest data in Enterprise search. With Elastic 8.8, new connectors such as MongoDB, MySQL, Postgres, and Microsoft SQL connectors are now generally available, along with the Python framework for writing your own connectors.
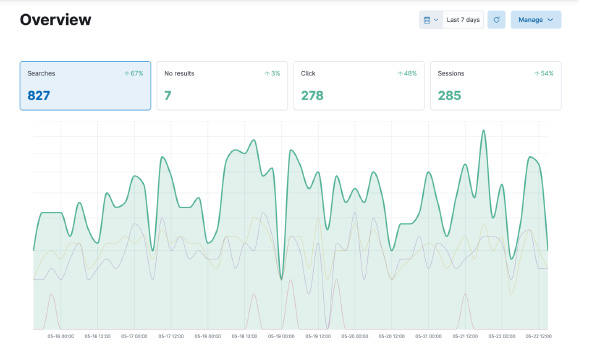
Enterprise Search now provides out-of-the-box behavioral analytics dashboards so it’s now even easier to see whether frequently used search terms are returning relevant results.


OBSERVABILITY
The most important highlight in the Elastic Observability department is the general availability of Synthetic Monitoring. It complements the already existing suite of log and monitoring solutions by adding support for site reliability workflows in the form of end-to-end functional and full browser tests. In modern application solutions, this becomes crucial, as certain levels of availability and resiliency need to be maintained.
To top it all off, Synthetic Monitoring tests are written as code using the Playwright testing framework. This allows you to manage your monitors as code in version control. This has added benefits, such as enabling you to first verify in a staging environment before continuing to production or providing the opportunity to centralize your test code.
Cybersecurity
Elastic Security brings an improved alert triage, which allows to group and filter security alerts. This allows us to better manage and prioritize countless alerts that come in every day.
To improve the MTTR (mean time to react), 8.8 adds the execute response action, allowing you to remotely execute commands without the need to physically access the host.
The new release is also adding a data quality dashboard to let you quickly check whether your data is aligned with the Elastic Common Schema by displaying a list of mapping conflicts per index. In addition to that, it also shows disk usage across different indices.
Container Workload Protection is a new beta feature that focuses on three fronts:
- Detecting unique threats against containerized environments
- Detecting changes in container file systems
- Locking down containers upon unauthorized access
As a final feature in the security department, Cloud Native Vulnerability Management provides beta support against security risks in Cloud workloads.
KIBANA
Last but not least, Kibana also has a few new features in store. It is now possible to use Kibana in dark mode. In addition, the new version also allows using custom brandings such as a logo, organization name, and browser icon.
For Machine Learning, the Discover view now allows running pattern analysis directly, and for alerts, it’s now possible to plan maintenance windows to reduce incoming alerts and notifications.
Elk Factory – elite Elastic Partner
Elk Factory is the Elastic partner to implement the Elasticsearch platform. We aim for a win-win! We look at how this platform can make your company benefit the best, in return we can enjoy another satisfied customer!
Get to know us and contact us without obligation.
