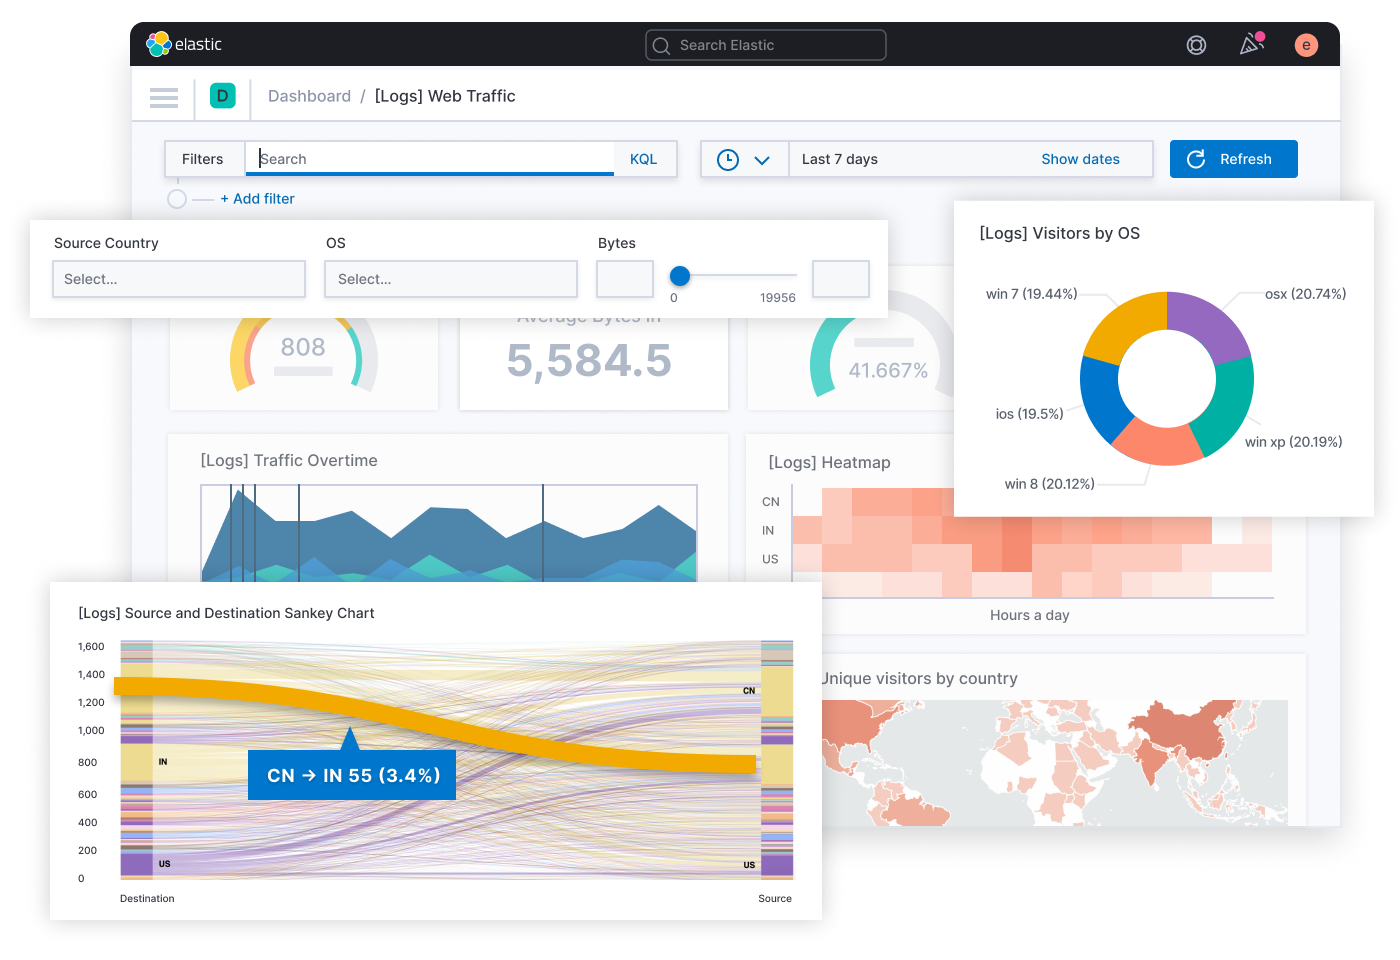
Kibana data
visualisation with elastic
Kibana is the open-source data visualization and exploration tool of Elastic used for analyzing and visualizing log data stored in Elasticsearch. It allows users to create and share dynamic dashboards, perform ad-hoc analysis, and visualize data in various forms such as charts, tables, maps, and more.
Kibana can be used for Elastic security and observability. It is a key component of the Elastic Stack. The set of open-source tools for data management and analysis. For cybersecurity, Kibana can be used to monitor and detect potential security threats and to visualize and analyze security-related data such as logs and alerts from various sources.
In the context of observability, Kibana can be used to gain visibility into the performance and behavior of systems, applications, and infrastructure, to help diagnose and resolve issues faster.
Kibana can be used for:
- Log analysis and monitoring: Kibana is often used to analyze log data from various sources, including applications, servers, and network devices, to detect and diagnose problems.
- Business intelligence: Kibana can be used to create visualizations and dashboards to help businesses make data-driven decisions.
- IT operations: Kibana is useful for IT operations to monitor the health and performance of systems, applications, and infrastructure.
- Security and compliance: Kibana can be used for security and compliance purposes, such as to monitor and alert on potential security threats and compliance violations.
- Website and application analytics: Kibana can be used to track website and application usage and performance, such as to monitor traffic, page views, and conversion rates.

