Observability is fundamental to understanding and improving how systems and applications perform and maintain their health. This specific approach integrates the extensive gathering and examination of data via logs, metrics, and traces, presenting a complete insight into the mechanics of IT environments.
A critical component of Observability is APM, also known as Application Performance Monitoring. APM focuses specifically on the performance and reliability of applications, providing targeted insights into user experience impacts like delays and errors. This approach to monitoring allows teams to quickly identify and address issues, making sure that there is an optimal application performance within the broader scope of system health.
Why Application Performance Monitoring (APM) matters
Optimal application performance is essential for businesses to function. Application Performance Monitoring (APM) plays a crucial role in achieving this goal by providing valuable insights into application behavior and performance. Let’s explore how APM benefits companies:
Improved user experience: APM helps ensure a smooth and responsive user experience, critical for customer satisfaction and retention by monitoring application performance in real time.
Enhanced operational efficiency: APM tools enable quicker identification and resolution of performance issues, therefore, and as a result, reduces downtime and operational costs.
Optimized root cause analysis: APM provides detailed insights into application behavior, it becomes easier to perform root cause analysis and prevent future issues.
Reduced MTTR: With APM, businesses can significantly lower the mean time to resolution for application issues, this ensures minimal impact on business operations.
DevOps practices support: APM integrates into continuous integration and continuous deployment (CI/CD) pipelines. It promotes more efficient development and deployment practices.
Optimized resource allocation: By identifying underperforming resources or bottlenecks, APM allows for better allocation of IT resources, increasing overall system performance.
How Application Performance Monitoring (APM) works in Elastic
APM works by monitoring, collecting, and analyzing data from applications to track their performance and identify issues that could affect user experience. It uses tools to gather detailed information about how applications behave and interact with underlying infrastructure. This data is analyzed to detect anomalies, performance bottlenecks, or errors, allowing IT teams to perform root cause analysis and resolve issues quickly.
APM provides visibility into the application’s operations, from the end-user experience through to the backend processes, ensuring that applications meet performance standards and user expectations.
Elastic APM, part of the Elastic Stack, extends this functionality by offering seamless integration with logging and metrics, providing a unified view on system and application health. It can use several alternatives to gather performance metrics, errors, and transaction data related to your applications. This data is then visualized in Kibana, allowing for in-depth analysis and monitoring, enabling teams to quickly address issues and improve application performance.
A more specific outline of the process includes the following:
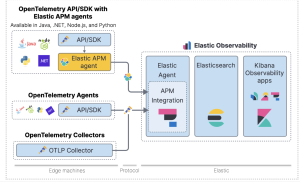
Instrumentation: Elastic APM supports various methods for instrumenting your applications to gather data, ensuring flexibility to suit different environments and requirements. While the integration of the Elastic APM agent directly into your codebase is a common approach, collecting detailed metrics on application performance, there are alternative methods available. Specifically, Elastic supports the use of OpenTelemetry, a set of APIs, libraries, agents, and instrumentation that allow you to collect and send telemetry data (metrics, logs, and traces) to monitoring tools like Elastic APM. This approach allows for the use of OpenTelemetry agents and SDKs, which can be particularly useful in environments where the Elastic APM agent is not the preferred option. Furthermore, the OpenTelemetry Collector, configured as an OTLP (OpenTelemetry Protocol) endpoint, can be used to aggregate and forward telemetry data from your applications to Elastic APM without needing direct instrumentation with an APM agent.
Data Collection: Through the alternatives provided by OpenTelemetry integration, data collection can extend beyond the traditional agent-based approach. When using OpenTelemetry agents or the OpenTelemetry Collector (OTLP Collector), your applications can still capture comprehensive performance metrics, traces, and errors. This includes information on transaction durations, database queries, external service calls, and more, similar to what’s collected via the Elastic APM agent. The OTLP Collector, in particular, offers a versatile and scalable method to gather telemetry data from various sources and forward it to Elastic APM. This flexibility ensures that regardless of the specific instrumentation strategy—be it direct agent integration or utilizing OpenTelemetry components—you can efficiently collect the necessary data to monitor and analyze your application’s performance effectively.
Data Transmission: The collected data is transmitted securely to the Elastic Stack, where it’s stored in Elasticsearch, a distributed search and analytics engine.
Data Analysis: In Elasticsearch, the APM data is indexed and analyzed using built-in APM-specific indices and mappings. This allows for fast and efficient querying and visualization of the collected data.
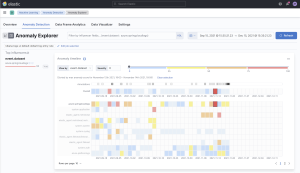
Visualization in Kibana: The analyzed APM data is visualized in Kibana, Elastic’s data visualization platform. Kibana provides various pre-built dashboards and visualizations tailored specifically for APM data. These visualizations offer insights into application performance, error rates, transaction latency, and other key metrics.
Monitoring and Alerting: Elastic APM also supports monitoring and alerting capabilities. Teams can set up custom alerts based on predefined thresholds or anomalies detected in the APM data. This allows for proactive monitoring and quick response to performance issues.
Integration with Logging and Metrics: One of the key strengths of Elastic APM is its integration with the broader Elastic Stack. This integration allows APM data to be correlated with logs and metrics collected from the same infrastructure. By combining APM data with logging and metrics data, teams gain deeper insights into the root causes of performance issues and can troubleshoot more effectively.
Overall, Elastic APM provides a comprehensive solution for monitoring and optimizing application performance. By instrumenting applications, collecting detailed performance data, analyzing it in Elasticsearch, and visualizing it in Kibana, teams can gain valuable insights into their applications’ behavior and ensure they meet performance expectations.
Discover how our expertise in implementing and optimizing APM solutions, including Elastic APM, can transform your business. Let’s ensure your applications deliver exceptional user experiences and drive operational efficiency. Reach out to us to schedule a consultation and take the first step towards maximizing the potential of your IT infrastructure.